It's Wednesday and I discuss a number of topics today. First, the 'million simulations' that…
Strong US growth disguises worrying trends
Last Friday (April 26, 2019), the US Bureau of Economic Analysis published their latest national accounts data (advance estimate) – Gross Domestic Product, First Quarter 2019 (Advance Estimate) – which tells us that the annualised real GDP growth rate of 3.2 per cent surprised most commentators (for its strength). As this is only the “Advance estimate” (based on incomplete data) there is every likelihood that the figure will be revised when the “second estimate” is published on May 30, 2019. Underlying the strong headline figure, however, are shifting expenditure patterns in the US. Household consumption growth is declining and the contribution to growth was down from 1.7 points in December 2018 to 0.82 points. The personal saving rate rose from 6.8 per cent of disposable income to 7 per cent as households tightened up in the face of record levels of debt and sluggish wages growth. The investment rose and Gross private domestic investment also contributed 0.92 points to growth, up from 0.66 points. However, that contribution was driven mostly by a rise in inventories, which can signal two things – either unsold goods due to firms overestimating domestic demand or stock-building in expectation of stronger future spending. I suspect it is the first of these explanations. Further, net exports were a strong contributor (1.03 points) after undermining growth in the December-quarter 2018. Real disposable personal income increased 2.4 per cent (down from 4.3 per cent in December). Overall, and notwithstanding the strong growth, the problems for the US growth prospects are two-fold: (a) What will be the contraction in consumption expenditure growth with slow wages growth and elevated personal debt levels? Most of the consumption growth is coming because more people are getting jobs even though wages growth is flat. (b) Can net exports growth defy Trump’s trade policy? We will wait and see.
US economy – what is going on at the aggregate level?
The US Bureau of Economic Analysis said that:
Real gross domestic product (GDP) increased at an annual rate of 3.2 percent in the first quarter of 2019 … In the fourth quarter of 2018, real GDP increased 2.2 percent.
Note that the BEA is using the annualised quarterly figure here (multiplying the March-quarter growth by 4) rather than the actual annual (year-on-year) growth rate which is the percentage shift from the March-quarter 2018 to the March-quarter 2019.
That growth figure was 3.21 per cent, up from 2.97 per cent in the December-quarter. The quarter-on-quarter growth outcome of 0.78 per cent was up on the December-quarter result of 0.54 per cent.
The following sequence of graphs captures the story.
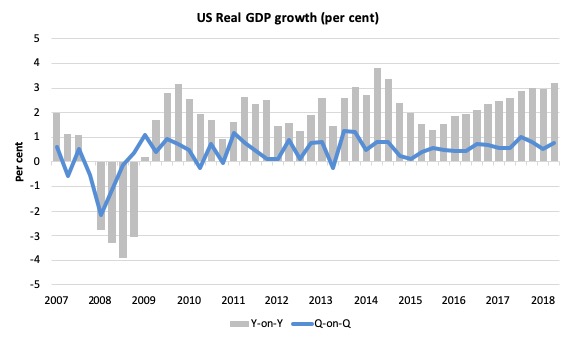
The first graph shows the annual real GDP growth rate (year-to-year) from the peak of the last cycle (December-quarter 2007) to the March-quarter 2019 (grey bars) and the quarterly growth rate (blue line). Note the date line starts at December-quarter 2007.
The year-to-year growth calculation smooths out the considerable volatility in the quarterly data to help us see the trend.
The grey bars suggest there is growing momentum in US growth in terms of the annual growth rate (year-on-year).
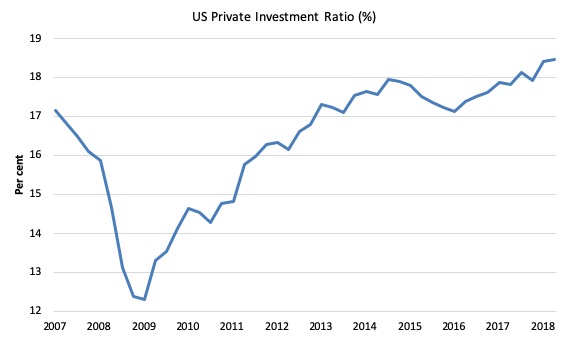
The next graph shows the evolution of the Private Investment to GDP ratio from the December-quarter 2007 (real GDP peak prior to GFC downturn) to the March-quarter 2019. Note the date line starts at December-quarter 2007.
The decline in the investment ratio as a result of the crisis was substantial and endured for 2 years. As a result the potential productive capacity of the US contracted somewhat. There are various estimates available but the overall message is that potential GDP fell considerably as a result of the lack of productive investment in the period following the crisis.
The retreat in the Investment ratio after the June-quarter 2015, appears to have been arrested and while the ratio trending upwards, rising from 17.9 per cent in the September-quarter 2018 to 18.5 per cent in the March-quarter 2019.
In fact, the ratio is now at its highest level since the current BEA data series began in the June-quarter 1947.
In this blog post – Common elements linking US and UK economic slowdowns (May 1, 2017) – I discussed estimates of potential GDP in the US and the shortcomings of traditional methods used by institutions such as the Congressional Budget Office.
So if you are interested please go back and review that discussion.
The latest CBO estimates, made available through – St Louis Federal Reserve Bank, show why we should be skeptical.
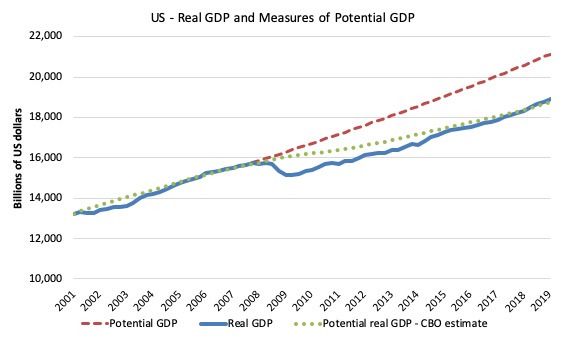
To get some idea of what has happened to potential real GDP growth in the US, the next graph shows the actual real GDP for the US (in $US billions) and two estimates of the potential GDP. There are many ways of estimating potential GDP given it is unobservable.
While I could have adopted a much more sophisticated technique to produce the red dotted series (potential GDP) in the graph, I decided to do some simple extrapolation instead to provide a base case.
The question is when to start the projection and at what rate. I chose to extrapolate from the most recent real GDP peak (December-quarter 2007). This is a fairly standard sort of exercise.
The projected rate of growth was the average quarterly growth rate between 2001Q4 and 2007Q4, which was a period (as you can see in the graph) where real GDP grew steadily (at 0.65 per cent per quarter) with no major shocks.
If the global financial crisis had not have occurred it would be reasonable to assume that the economy would have grown along the red dotted line (or thereabouts) for some period.
The gap between actual and potential GDP in the March-quarter 2019 is around $US2,291.2 billion or around 10.5 per cent.
That gap rose steadily since late 2014 but then stabilised and has been declining since the March-quarter 2018.
In the March-quarter 2018, it fell by 0.1 points as a result of the stronger growth.
The green dotted line is the estimate of potential output provided by the US Congressional Budget Office and made available through – St Louis Federal Reserve Bank.
In relation to the CBO estimate, the US economy is estimated to be operating at 0.8 per cent over its potential in the March-quarter 2019.
It is hard to believe the estimate!
As a hint, the BEA report for the National Accounts release notes that:
The price index for gross domestic purchases increased 0.8 percent in the first quarter, compared with an increase of 1.7 percent in the fourth quarter … The PCE price index increased 0.6 percent, compared with an increase of 1.5 percent. Excluding food and energy prices, the PCE price index increased 1.3 percent, compared with an increase of 1.8 percent.
That is, price pressures declined, hardly symptomatic of an economy that is operating at 0.8 per cent over its capacity.
Further, wages growth is contained and broader measures of labour underutilisation indicate there is still considerable slack.
Which suggests that the CBO estimates are inaccurate – probably by several percentage points.
We know (and I explain this in more detail in the blog post mentioned above), the CBO base their estimate of Potential GDP on their estimate of the NAIRU – the (unobservable) Non-accelerating Inflation Rate of Unemployment.
This is a conceptual unemployment rate that is consistent with a stable rate of inflation.
The literature demonstrates that the history of NAIRU estimation is far from precise. Studies have provided estimates of this so-called ‘full employment’ unemployment rate as high as 8 per cent or as low as 3 per cent all at the same time, given how imprecise the methodology is.
The former estimate would hardly be considered “high rate of resource use”. Similarly, underemployment is not factored into these estimates.
The continued slack in the labour market (bias towards low-pay and high underemployment) would lead to the conclusion that the output gap is likely to be somewhat closer to the extrapolated estimate than the CBO estimate.
The question to ask is this: How much lower would the unemployment rate and the broader underutilisation rate go if the US federal government offered a Job Guarantee on an unconditional basis?
I would bet the answer would be much lower without any inflation acceleration emerging.
Contributions to growth
The accompanying BEA Press Release said that:
The increase in real GDP in the first quarter reflected positive contributions from personal consumption expenditures (PCE), private inventory investment, exports, state and local government spending, and nonresidential fixed investment. Imports, which are a subtraction in the calculation of GDP, decreased … These contributions were partly offset by a decrease in residential investment.
The acceleration in real GDP growth in the first quarter reflected an upturn in state and local government spending, accelerations in private inventory investment and in exports, and a smaller decrease in residential investment. These movements were partly offset by decelerations in PCE and nonresidential fixed investment, and a downturn in federal government spending. Imports, which are a subtraction in the calculation of GDP, turned down.
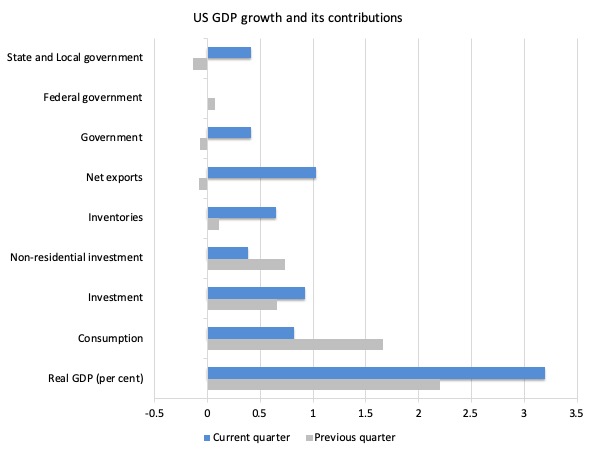
The next graph compares the March-quarter 2019 (blue bars) contributions to real GDP growth at the level of the broad spending aggregates with the December-quarter 2018 (gray bars).
When I previously said that the aggregate data was seemingly trending upwards, digging deeper into the individual components suggests that the trend might be short-lived.
The positive overall growth outlook masks a distinct softening in private consumption spending. In the December-quarter 2018, it contributed 1.7 points to the overall growth of 2.2 per cent. By the March-quarter 2019, this contribution had fallen significantly to 0.82 points.
It was always a question of when not if that private consumption spending would start to wane, given the household debt remaining high (see below) and the sluggish real wages situation.
Most of the consumption growth has coming because more people are getting jobs even though wages growth is flat. This cannot persist obviously.
In line with the rising investment ratio, Gross private domestic investment also contributed 0.92 points to growth, up from 0.66 points.
However, most of that was from the Change in Private inventories (unsold goods) – 0.65 points (up from 0.11 points).
Household investment continues to decline, and has down so for 5 consecutive quarters.
The Government sector added 0.41 points to the March-quarter 2019 growth up from a negative result in the previous quarter.
That contribution, however, was dominated by the State and Local governments with the Federal government contributing nothing to growth.
The standout result in the March-quarter 2019 was the strong contribution of net exports (1.03 points) after undermining growth in the December-quarter 2018.
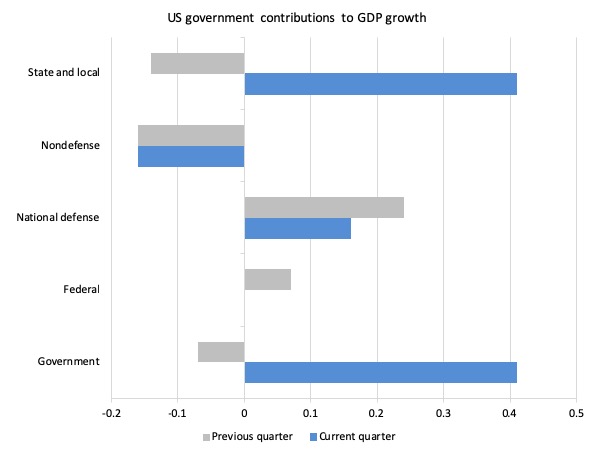
The next graph decomposes the government sector and shows that all levels of government contributed significantly to growth in the current-quarter and increased the contribution relative to the previous-quarter.
While the overall federal contribution was zero – strong military expenditure contributed 0.16 points, while cuts in non-defense spending offset this.
That has been a trend under the current Presidency – a worrying sign.
However, the latest SIPRI release – World military expenditure grows to $1.8 trillion in 2018 (released April 29, 2019) shows that as a percentage of GDP, military expenditure in the US has risen from 3.1 per cent to 3.2 per cent in 2018. It is well down on the 2010 figure of 4.7 per cent.
You might think that is because GDP fell in 2010, which is partly true. But in real terms (2017 prices), US military spending in 2010 was $US784,835 million, whereas in 2018 it was $US633,565 million.
I will analyse the military spending data in more detail in a separate blog post soon.
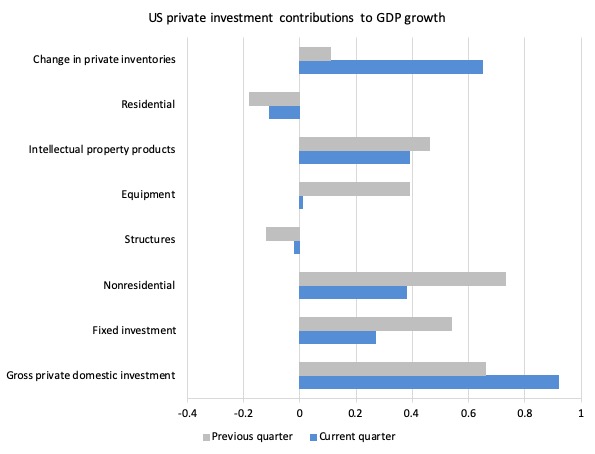
The next graph breaks down the contributions to real GDP growth of the various components of investment.
As noted above, the inventory cycle dominated. It is hard to know at this stage whether the buildup of inventories reflects the weakening domestic demand or positive expectations of firms anticipating stronger growth in the coming quarters.
Time will tell but a fair bet is that the rise in unsold inventories is the result of firms overestimating domestic spending growth and thus overproducing. There will be a reversal in the next quarter if that turns out to be the case.
So things are not as rosy as the overall aggregate result might suggest.
Household consumption and debt
The Federal Reserve Bank of New York publication – Household Debt and Credit Report – was last updated for the December-quarter 2018 (published February 2019) – (PDF Download).
It shows:
… total household debt rose by $32 billion, or 0.2 percent, in the fourth quarter of 2018 to reach $13.54 trillion. The total is now $869 billion higher than the previous peak of $12.68 trillion in the third quarter of 2008 and 21.4 percent above the post-financial-crisis trough reached in the second quarter of 2013 …
Mortgage balances shown on consumer credit reports on December 31 stood at $9.1 trillion, essentially unchanged from the third quarter of 2018. Balances on home equity lines of credit (HELOC) continued their declining trend from 2009 with a drop of $10 billion in the fourth quarter and are now at $412 billion, the lowest level seen in 14 years. Non-housing balances increased by $58 billion in the fourth quarter, with auto loans increasing by $9 billion, credit card balances going up by $26 billion, and student loan balances by $15 billion. The increase in credit card balances is consistent with seasonal patterns but marks the first time credit card balances re-touched the 2008 peak; card balances now stand at $870 billion.
The rise in non-housing debt (for example, credit card balances) is particularly worrying. It is a sign that household income growth is not sufficient to finance basic needs.
The decline in US household consumption spending growth is now clear and is probably a response to the pressures that the rising household debt levels are placing on household solvency.
The Data shows that:
Aggregate delinquency rates remained steady in the fourth quarter of 2018. As of December 31, 4.7% of outstanding debt was in some stage of delinquency, unchanged from the third quarter. Of the $630 billion of debt that is delinquent, $416 billion is seriously delinquent (at least 90 days late or “severely derogatory”). The flow into 90+ day delinquency for credit card balances has been rising since 2017, while the flow into 90+ day delinquency for auto loan balances has been slowly trending upward since 2012.
The following graph is taken from the FRBNY publication. Clearly the gap between mortgage and non-mortgage debt is rising as total household indebtedness rises.
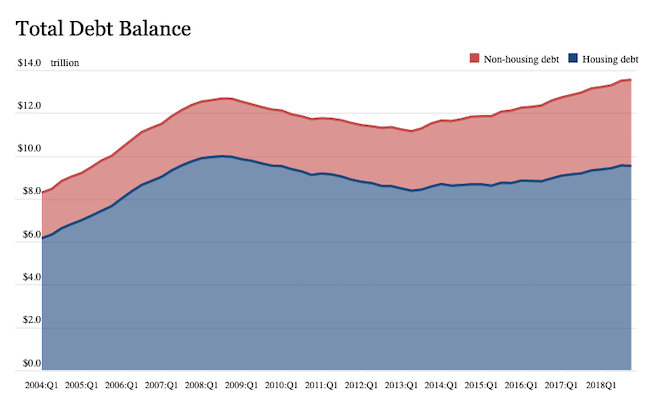
This looks to be an unsustainable situation and will require either significant non-government spending boosts in investment or net exports or government spending increases to offset the likely slowdown in household consumption spending.
Conclusion
The strong growth in the March-quarter 2019 was largely driven by inventory accumulation and net exports with a significant contribution from State and Local government.
Underlying the strong headline figure, however, are shifting expenditure patterns in the US. Household consumption growth is declining and the contribution to growth was down from 1.7 points in December 2018 to 0.82 points.
The personal saving rate rose from 6.8 per cent of disposable income to 7 per cent as households tightened up in the face of record levels of debt and sluggish wages growth.
The investment rose and Gross private domestic investment also contributed 0.92 points to growth, up from 0.66 points.
However, that contribution was driven mostly by a rise in inventories, which can signal two things – either unsold goods due to firms overestimating domestic demand or stock-building in expectation of stronger future spending. I suspect it is the first of these explanations.
Further, net exports were a strong contributor (1.03 points) after undermining growth in the December-quarter 2018. Real disposable personal income increased 2.4 per cent (down from 4.3 per cent in December).
Overall, and notwithstanding the strong growth, the problems for the US growth prospects are two-fold:
1. What will be the contraction in consumption expenditure growth with slow wages growth and elevated personal debt levels? Most of the consumption growth is coming because more people are getting jobs even though wages growth is flat.
2. Can net exports growth defy Trump’s trade policy?
We will wait and see.
That is enough for today!
(c) Copyright 2019 William Mitchell. All Rights Reserved.
Possible typos:
I fear you may have made a few typos, based on an earlier analysis.
1. The release is now entitled: “Gross Domestic Product, First Quarter 2019 (Advance Estimate) ”
2. Whereas the your text now reads: “the percentage shift from the March-quarter 2017 to the March-quarter 2018”, should it not read “the percentage shift from the March-quarter 2018 to the March-quarter 2019”?
Pls feel free to delete this
Dear Avid Reader (at 2019/04/29 at 11:41 am)
Thanks very much. I have corrected the typos.
best wishes
bill
You mention ‘net exports’ several times here as one of the stronger components of US GDP growth. I am surprised that the US has increasing ‘net exports’. Surprised that the US has any net exports to begin with. Or does that term describe a negative number that is getting somewhat less negative?
Either way, the MMT position is that exports are generally a bad thing to experience- even if they are good for GDP growth. (With a lot of ‘nuances’ about that statement that you have written about for sure). But is it fair to say that in an economy that is ‘demand’ constrained rather than at its full production supply limits, is it fair to say increasing exports increase demand for labor and probably improves the bargaining position and probably the incomes of labor in that country as a result?
You have said that the very apparent German policy of running trade surpluses results in a negative situation for Germany’s citizens and workers. But I just don’t see that when I look at their wage rates and unemployment rates and compare them to those in the rest of the world. That would be the world we live in right now rather than the best possible world that we can imagine.
The US increase in ‘net exports’ in this case is probably a good thing for US workers even if it really only means the trade deficit has decreased a little bit. No? And (hopefully) assuming we are exporting more of useful things that people want (rather than bombs), that would usually also be a good thing for those who buy them?
Don’t forget at the end of March, they bought themselves 0.4% growth by revising down the 2018 Q4 figure from 2.6 to 2.2%. Then according to Mike Shedlock there is also a massive fall in inflation measures that probably accounts for much of the ‘growth’ as such.
The price index for gross domestic purchases increased 0.8% in the first quarter, compared with an increase of 1.7% in the fourth quarter.
The PCE price index increased 0.6%, compared with an increase of 1.5% in the fourth quarter. Excluding food and energy prices, the PCE price index increased 1.3%, compared with an increase of 1.8%.
The GDP core price index was 1.3% vs 2.0% in the fourth quarter.
[Bill edited out link to site he doesn’t wish to promote]
Like Jerry Brown I too am puzzled by the word ‘defy’ re: Trump’s trade policies. I am under the impression Trump wants to increase exports, ergo a rise in them does not ‘defy’ his policy. Anyway, the savings rate rise, the personal consumption slowdown, the continuing lack of wage growth and consequent rise in private debt–and inventory increases–are cautionary at minimum. The dodgy use of NAIRU is also troubling. Is this intentional data manipulation? All in all, a nice analysis as usual.
Hi Bill,
just in case you hadn’t seen it yet, Paul Mason has his take on MMT in Medium:
[Bill deleted link – I don’t wish to promote this source]
Some cheap shots, but an interesting challenge about how supporters of e.g. the GND can come up with more concrete plans for managing their transition that can be evaluated. (He uses the word “costed” which is not the same thing – I think the challenge is still one GNDers need to address. The key thing for me is, when you get to an inevitable crunch around real resources, how can you manage the political fallout that comes from having to prioritise. I know this is outside of MMT, but some of the GNDers seem to be talking as if the problem doesn’t exist.
One thing that tickled me was Mason’s certainly of how Marxists view money and value, contra MMT. I would have described myself as a Marxist once and, as I remember it, you couldn’t get 3 Marxists in a room together without them disagreeing about money and value.
All the best
Matt
P.S. I still have that question from a previous thread about MMT in a growth constrained world.
One reason that U.S. exports are increasing is that the U.S. is the world’s largest oil producer and largest natural gas producer. We are exporting 2 million barrels of oil a day and that number is growing and an explosion in exports of liquified natural gas (LNG). All of those dollars that were ending up in Saudi Arabia when the U.S. was importing all that OPEC oil are staying in the U.S. and making oil producers and their employees wealthier. A contradiction to imports are good and exports are bad. And sometimes economic data should be measured per capita not in gross dollar terms especially when an economy is growing.
@Jerry Brown
Perhaps the “exports are a cost and imports a benefit” vs. “it’s good for our workers to be employed (in export industries)” conundrum goes away if you consider that it would be BETTER for our workers to be employed producing goods and services which remain and are consumed within our own borders. Of course this can only happen if we pay labor enough to consume what it produces.
For more on the pernicious effects (both external and internal) of the German undervaluation regime (which underpins their outsized export success) you could do worse than to start here:
http://www.mpifg.de/pu/mpifg_dp/2019/dp19-1.pdf
Yes ‘eg’- I agree it ‘could’ be better for our workers to be employed producing goods and services which remain and are consumed within our own borders. Ideally. We don’t live in an ideal world though. Which doesn’t mean that I don’t recognize that what you are saying would be true if only we did.
@ Jerry,
Exports are recognised as a cost under MMT, but that doesn’t make them a ‘generally bad thing’. Just like a budget surplus is not in itself a bad thing, or imports always a good thing. The only good or bad is the policy behind it.
I was surprised today listening to a podcast hosted by economist David Beckworth. This production is sponsored by the Mercatus center which is pretty much a libertarian/pro business type organization as far as I can tell. So I won’t link to it since I doubt Bill wishes to promote that site. But anyways- Beckworth was interviewing a journalist named Alexandra Scaggs in this week’s episode and their conversation was about the US economy and the US federal debt, the Federal Reserve, US government bonds and interest rates, and actually got into the subject of currency issuing governments. And believe it or not, they got into a ten minute discussion about MMT that was amazingly not inaccurate or really at all negative and which actually considered that MMT might be right. Which is what surprised me. Because it has been so rare to find any mainstreamish economists who are willing to even contemplate that MMT might be correct even though they have no arguments to show MMT is wrong in any way.
So anyways- I’m mostly just reporting this to show that MMT is making a considerable and increasing impact on economic discourse and that I think more and more people (even economists) are learning about it and realizing it is correct.