Today (March 6, 2024), the Australian Bureau of Statistics released the latest - Australian National…
Australian national accounts – economy slows to nearly half its trend rate of growth
The Australian Bureau of Statistics released the latest March-quarter 2019 National Accounts data today (June 5, 2019) and the data shows that annual GDP growth of 1.8 per cent is around half the historical trend rate. This is a very poor on-going result. The weaker performance started in the last 6 months of 2018 and has continued into the first three months of 2019. However, due to a fairly strong terms of trade, Real net national disposable income rose, which signifies rising material living standards. Overall, the quarterly growth rate was just 0.4 per cent. The weakness is exemplified by slackness in private domestic demand – weakening household consumption growth and poor business investment growth. The rise in the saving ratio recorded in the December-quarter may signal that households are finally just accepting that their consumption growth will have to be more subdued as they struggle with poor income growth and record levels of debt. The large government infrastructure projects (State-level) and public consumption expenditure are driving growth. Net exports also contributed to growth on the back of the rising terms of trade. The overall picture is not good and the future is looking rather dim at present.
The main features of the National Accounts release for the March-quarter 2019 were (seasonally adjusted):
- Real GDP increased by 0.4 per cent for the quarter – signalling continuing weakness. The annual growth rate was 1.8 per cent (and falling), well below trend.
- Real GDP per capita growth was zero after two successive quarters of negative growth.
- The main positive contributors to real GDP growth were Government consumption expenditure (0.2 points) and net exports (0.2 points).
- Australia’s Terms of Trade (seasonally adjusted) rose by 3 per cent in the quarter and 6.0 per cent over the 12 month period.
- Real net national disposable income, which is a broader measure of change in national economic well-being rose by just 0.9 per cent for the quarter and 3 per cent for the 12 months to the March-quarter 2019, which means that Australians are better off (on average) than they were at that point 12 months ago.
- The Household saving ratio (from disposable income) rose by 0.2 points to 2.8 per cent as household consumption expenditure slowed considerably. The saving ratio is still well below the levels that were observed following the GFC. The rise was due to a combination of a slight rise in disposable income and a reduced spending growth rate.
Overall growth picture – slowing towards recession
The ABS – Press Release – said that:
The Australian economy grew 0.4 per cent in seasonally adjusted chain volume terms in the March quarter 2019 …
Chief Economist for the ABS, Bruce Hockman, said: “Growth in the economy was subdued, reflecting soft household spending and a decline in dwelling investment. The approvals for dwelling construction indicate that the decline in dwelling investment will continue.” …
Government spending was the main contributor to growth reflecting ongoing delivery of services in disability, health and aged care.
Household spending slowed and contributed a modest 0.1 per cent to growth reflecting reduced spending on discretionary goods such as furnishing and household equipment, recreation and culture and hotels, cafes and restaurants.
Dwelling investment continued to detract this quarter. The slowing housing market has resulted in significant falls in ownership transfer costs, particularly stamp duty.
The Australian economy continues to grow but more slowly than our long term average of 3.5 per cent.
Points to note:
1. Household consumption expenditure growth is moderating and households have decided to increase the saving ratio so precarious are their indebted balance sheets.
2. For all those mainstream economists out there who teach your students that government spending does not create jobs, stop doing that.
It has been patently obvious that public works expenditure over the last year or so has been the difference between a positive (albeit tepid) growth rate and recession.
3. The big public infrastructure projects which are helping at present are obviously finite and are within an environment where the federal government is obsessed with recording a surplus. The public spending is coming from State governments (large transport projects mainly).
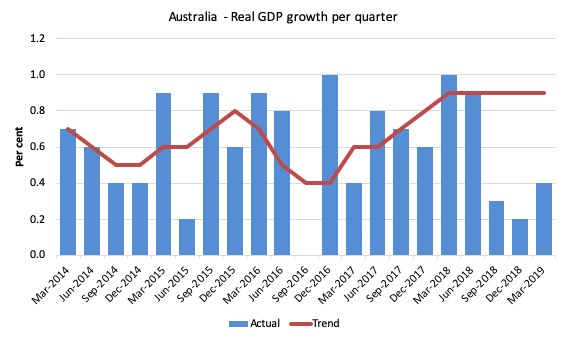
The first graph shows the quarterly growth over the last five years (with the red line being the ABS moving average trend). The trend growth is now flat (and would have been negative except for the spike outlier in the March-quarter 2018).
It is now clear that the spike in quarterly growth for March was not the sign of a new period of above-trend growth.
Real GDP per capita recession?
The big story from the the last data release (December-quarter 2018) was that in per capita terms, Australia recorded two consecutive quarters of negative growth in real GDP per capita – leading to the statement that it was a per capita growth recession.
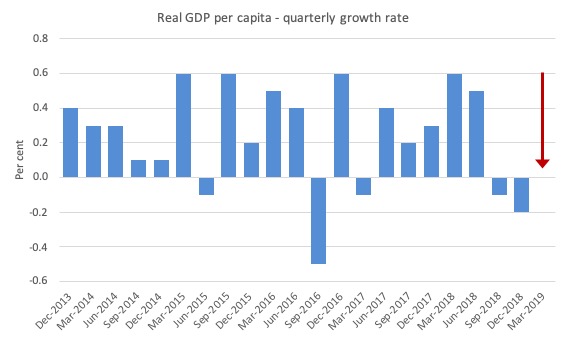
In the March-quarter 2019, real per capita GDP growth was zero (signified by the red arrow in the next graph).
The following graph shows the quarterly growth rate over the last five years to the March-quarter 2019.
The data shows that there was a rather significant reduction in economic activity over the last several months of 2018 which has continued into 2019.
Analysis of Expenditure Components
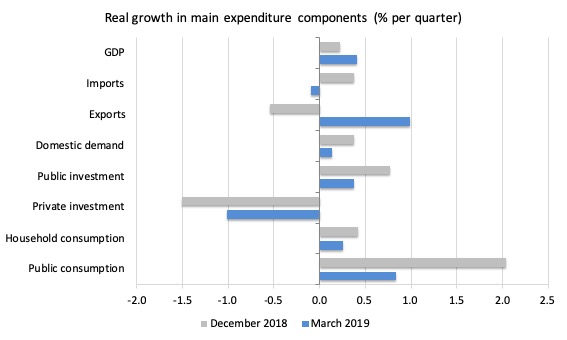
The following graph shows the quarterly percentage growth for the major expenditure components in real terms for the March-quarter 2019 (blue bars) and the December-quarter 2018 (grey bars).
The overall growth performance is being driven by the strength of public consumption and investment expenditure.
Without the strong public expenditure growth, overall GDP growth would now be negative (see below).
Private investment expenditure growth declined by 1 per cent and has been slowing for several quarters now.
Household consumption expenditure growth halved in the first three months of 2019 – a trend that has been unfolding for some quarters now.
The growth in exports is being driven by iron ore (and favourable terms of trade).
Contributions to growth
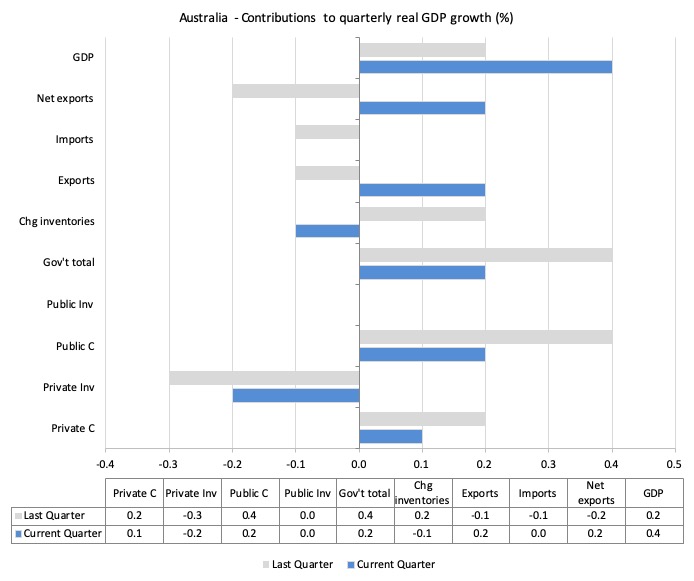
What components of expenditure added to and subtracted from the 0.4 per cent real GDP growth in the March-quarter 2019?
The following bar graph shows the contributions to real GDP growth (in percentage points) for the main expenditure categories. It compares the March-quarter 2019 contributions (blue bars) with the December-quarter 2018 (gray bars).
Net exports added 0.2 percentage points driven by a rise in exports (and rising terms of trade)
Household consumption expenditure contributed 0.1 points to the overall growth result – and is weakening.
Private investment expenditure undermined growth by 0.2 points.
The government sector contributed 0.2 points to the overall growth result.
Material living standards rise in March-quarter 2019
The ABS tell us that:
A broader measure of change in national economic well-being is Real net national disposable income. This measure adjusts the volume measure of GDP for the Terms of trade effect, Real net incomes from overseas and Consumption of fixed capital.
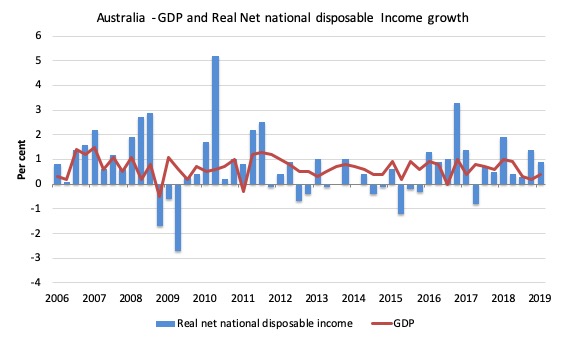
While real GDP growth (that is, total output produced in volume terms) grew by 0.4 per cent in the March-quarter 2019, real net national disposable income growth grew by 0.9 per cent as a result of the strong terms of trade.
Over the 12 months to the March-quarter 2019, Real net national disposable income grew by 3 per cent, which means that Australians were better off (on average) in real income terms than they were twelve months prior.
The following graph shows the evolution of the quarterly growth rates for the two series since the December-quarter 2006.
Household saving ratio turns upwards – finally
The saving ratio rose by 0.2 points to 2.8 per cent arresting the consistent decline since 2016.
The ratio fell for the four-quarters in 2018 as households struggled to maintain their consumption expenditure growth in the face of flat wages growth.
Perhaps this quarter’s result signals an end to that struggle – as household debt grows to record levels – and households are now trying to reduce their spending growth.
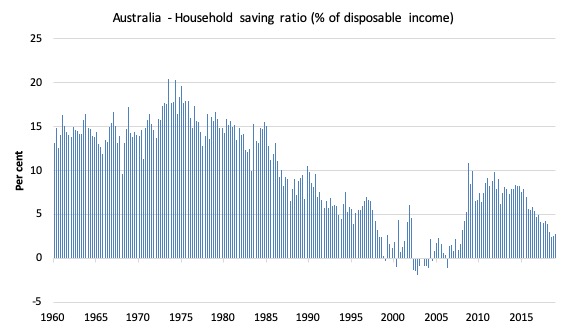
The following graph shows the household saving ratio (% of disposable income) from the March-quarter 1960 to the current period.
In the December-quarter 2008, the ratio was 10.9 per cent having risen sharply in the early days of the GFC as households tried to stabilise the record debt situation.
Once the GFC threat was contained by the massive fiscal stimulus, the saving ratio began to fall again, especially as the squeze on wages has intensified.
In the December-quarter 2016, the household saving ratio was 5.5 per cent (still much lower than historical norms).
Whether the rise in the March-quarter 2019 marks a more permanent shift will have to be seen.
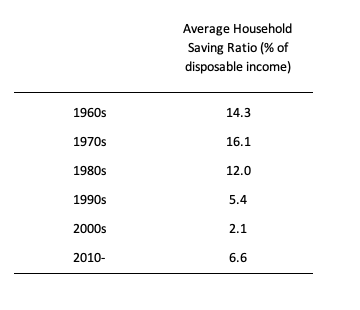
The following table shows the impact of the neoliberal era on household saving. These patterns are replicated around the world and expose our economies to the threat of financial crises much more than in pre-neoliberal decades.
Real GDP growth and hours worked
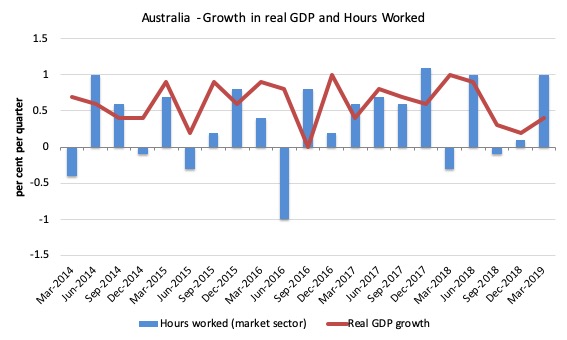
The following graph presents quarterly growth rates in real GDP and hours worked using the National Accounts data for the last five years to the March-quarter 2019.
You can see the dislocation between the two measures over the period to mid-2016 (it actually began in 2011). In other words, GDP was growing while hours worked growth was variable but often zero or negative.
From then until the December-quarter 2018, the two series moved more or less together, despite the blip in the March-quarter 2018.
But the March-quarter data shows that total hours worked rose sharply while GDP growth was just 0.4 per cent. This means that productivity growth fell sharply.
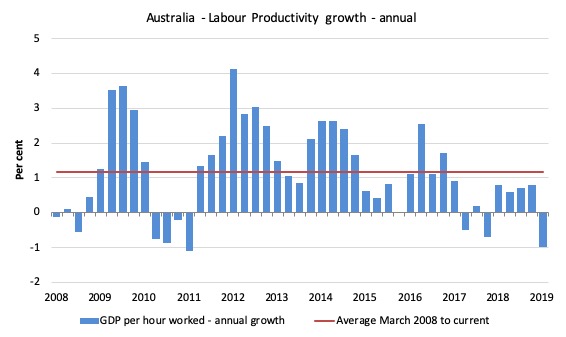
To see the above graph from a different perspective, the next graph shows the annual growth in GDP per hour worked (labour productivity) from the March-quarter 2008 quarter to the March-quarter 2019. The horizontal red line is the average annual growth since March-quarter 2008.
The relatively strong growth in labour productivity in 2012 and the mostly above average growth in 2013 and 2014 helps explain why employment growth was lagging given the real GDP growth. Growth in labour productivity means that for each output level less labour is required.
In the March-quarter 2019, annual labour productivity growth fell by 1 per cent.
Conclusion
Remember that the National Accounts data is three months old – a rear-vision view of what has passed and to use it to predict future trends is not straightforward.
Coming up with assessments of where the economy is heading requires analysis of the more recent data – such as labour force surveys and the like.
But the National Accounts data indicates that the Australian economy continued to perform weakly – a trend started in the last 6 months of 2018.
Annual growth is just 1.8 per cent nearly half the historical trend rate.
The weakness is exemplified by slackness in private domestic demand – weakening household consumption growth and poor business investment growth.
The rise in the saving ratio recorded in the December-quarter may signal that households are finally just accepting that their consumption growth will have to be more subdued as they struggle with poor income growth and record levels of debt.
The large government infrastructure projects (State-level) and public consumption expenditure are driving growth.
Net exports also contributed to growth on the back of the rising terms of trade.
Overall, the Australian growth outlook remains shaky.
That is enough for today!
(c) Copyright 2019 William Mitchell. All Rights Reserved.
Dear Bill,
OT, but I’d like to thank and congratulate you and Thomas Fazi for your excellent riposte to James Meadway, published in Tribune magazine today…
https://tribunemag.co.uk/2019/06/for-mmt
Not just for your first class technical rebuttal, which was to be expected, but also the appeal to hope and optimism – as opposed to Meadway’s caution and fear – in its conclusion.
Best, Mr S.
Thank you, Bill, for another great post and Mr. Shigemitsu for the link to an inspiring article.
Bill and Thomas point out in the linked article:
“Unfortunately, the mainstream macroeconomic narrative continues to plague large swathes of the left, particularly in Europe.”
Europe is simply too old fashioned and fearful to throw “conventional wisdom” out the window. I have come to believe that change will have to come across the pond first, before us Europeans (especially in the rich states and regions) pull our heads out of our collective [redacted]. Unfortunately, it has come to be a race between that happening and one of the mostly right-leaning antagonists of the EU to seize the austerity-induced rage and do something stupid. Biden, Booker and Harris leading the polls as the Dem’s next presidential candidate and Salvini’s newest standoff with the EU over Italy’s budget makes the latter seem ever more likely.